Weight Loss (or Gain) goals
- What do you mean by "what is the most your weight can change in one day"?
- How can I set the rate or add my target?
- How do I enter data?
- My safety buffer jumps around a lot, e.g. I was safe for several days, but when I entered data, I derailed!
- I reached my goal weight! Can I keep the goal going, but switch to maintaining?
- Can I set a goal that keeps me within a certain range?
- Can I hide the numbers on my graph? I want to show it off, but I want to hide my true weight value.
- Sample Weight Loss/Weight Gain goal creation
Weight Loss and Weight Gain goals are simple in theory: enter your weight every day, and stay above/below the bright red line. If you have a Fitbit or Withings scale, you can even have Beeminder update a weight goal automatically!
However, these goals can be a little tricky compared to Do More goals, so let's dig into the complexities...
What do you mean by "what is the most your weight can change in one day"?
A lot of people find their weight fluctuates in small ways from weigh-in to weigh-in: up 0.5lbs here, down 1lb there. It eventually balances out, because it's a matter of having missed a meal or drinking extra water on a hot day... but a single straight slope up or down towards your goal doesn't take that daily fluctuation into account.
When you create your weight goal, you let us know how big that fluctuation can be within a short time. If you never see differences of more than 0.5lbs in a day, then 0.5lbs is the most your weight can change in one day, and you want to put in "0.5" in that field. For some people, that number might be 2lbs. It's very personal, and there's no single "right" answer.
We call that amount "fluctuation buffer", "flux" or "maxflux", and it gets added on top of your current weight when the goal starts and after derailments. If you find yourself losing that buffer, that means you're not keeping up with the rate you set, and you'll run out of buffer for those daily fluctuations.
If you're just starting out and you're not sure, you should set this nice and high. You can always ratchet later if you find the amount of safety buffer excessive, but it takes a week to add more safety buffer if you find you're getting too close to the line!
How can I set the rate or add my target?
Once your goal is all set up, you'll start with a default (very) low daily rate. Then you can use the commitment dial to set your own rate, or configure a target weight, or a date to reach your goal. There are always three parameters, and you can set two of them (the third is inferred from the other two).
If the default slope at the start is too much (e.g. you want to just maintain your current weight), then contact us and let us know! It'd be really useful feedback to hear, and we'll be able to help you get things set up the way you want.
How do I enter data?
You literally enter your scale weight! The lowest weight you enter within the day will count, so you can weigh in at (for example) 180lbs in the morning, and then work out and scrape in at 179.5lbs later to save yourself from derailing. If you've set up a goal with data from a Fitbit or Withings scale, just step on your scale and as long the data syncs to Fitbit/Withings, we'll pull it in automatically at some point during the day.
My safety buffer jumps around a lot, e.g. I was safe for several days, but when I entered data, I derailed!
"Safe for five days" (as an example) means that you have five days to enter a datapoint that's higher/lower than your last datapoint. If you draw a straight line from your datapoint to where it meets the bright red line in the future, and then down to the x-axis, you'll see that date is the last day you'll be safely on track with that amount.
As a consequence, your number of safe days can fluctuate a lot. If you're safe for five days, and then you enter a much lower number, on a weight loss graph you'll be safe for much longer. If the next day you enter the same number you originally had, you'll be back to just a few days of buffer.
I reached my goal weight! Can I keep the goal going, but switch to maintaining?
Awesome, and absolutely! Set a goal date and the goal rate to 0 to flatten out the bright red line until the goal reaches its end date, which you should push years into the future (we don't yet have a way to commit to doing something literally forever, but we should!).
Can I set a goal that keeps me within a certain range?
No. The Weight Loss goal sets a daily maximum; the Weight Gain goal sets a daily minimum. If you want to stay within a range of values, you could use one of each goal to enforce both limits. But realistically, that's unnecessary (or if it's necessary for you, we suggest you use two different graphs). One side of the bright red line (probably losing or not gaining weight) is difficult and the other side (probably gaining) is easy, so in general, just beemind what's hard and stay in range on the other end by just keeping an eye on the graph.
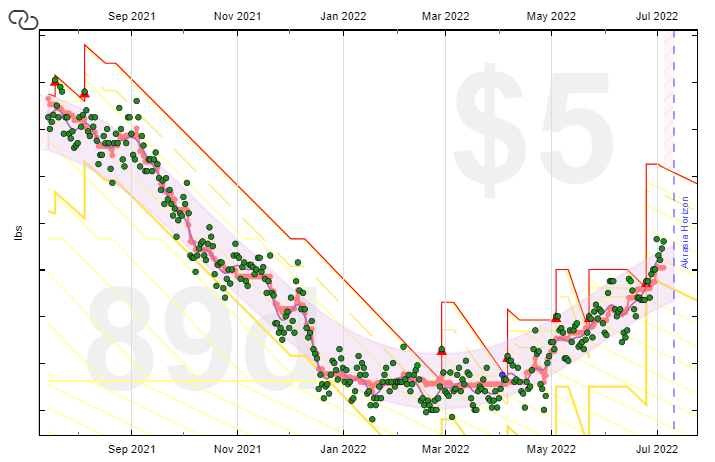
Can I hide the numbers on my graph? I want to show it off, but I want to hide my true weight value.
We built a feature just for this use case! In the graph settings, tick the Hide the numbers on the y-axis of the graph box, then click Update Graph to save changes. This will remove all datapoint values from your publicly-accessible goal page, so you can share your progress without sharing your weight.
Your datapoints are already hidden by default, so people can't see those unless you check an extra button in settings to make them available. Here's how it looks:
Sample Weight Loss/Weight Gain goal creation
- Head to create a new goal (also accessible through the New Goal link in the top menu).
- Click the + icon to start a new manual entry goal.
\"")
- Select Lose Weight or Gain Weight as your goal type (depending on which direction you want to go in). We're going with "Lose Weight" for this example, but the process is much the same for Gain Weight goals!

- Now we need to enter today's weight! Kilograms and pounds are more usual, but I'm going to use a made-up unit, "elephants", because I don't want to seem to suggest what weight anyone should be at or aiming for (that's all up to you).
So today I weigh 20 elephants, so I put that in the "Today's value" field. I know that my weight can fluctuate by about 0.5 elephants per day just from ordinary eating and drinking -- that's the sort of fluctuation that isn't meaningful, so I don't want to derail if I weigh 20.5 elephants tomorrow. So I enter 0.5 as the amount my weight can change in one day.
If your weight fluctuates a lot, you might want to add a higher number in here, just to be safe. You can always ratchet your goal later if it's too easy to stay on track, but you can't quickly increase your safety buffer if you've given a low number.

You properly set the rate etc once the goal has been created, unlike with most other Beeminder goals, so click continue and carry on to... - Give your goal a brief name. If you want, you can also write a short description with more information.

- Finally, choose your initial pledge. This is the amount you will pay the first time you derail on the goal. After derailing, the pledge will increase by default — use the dropdown below to control how high it goes by selecting the cap. In the example below, I have chosen to start at a $5 pledge, which will increase each time I derail, until it reaches $270 — the pledge cap. (To read more about pledges and payments, check out some FAQs!)
If you want to start out with a sort of trial period, you can choose to start the goal at $0. If you do that, the pledge will automatically increase to $5 after seven days. If you derail before that, it will also increase to $5.
\", with a demonstration below showing the pledge progression: 5, 10, 30, 90... to the pledge cap, which currently shows $270. Below, a checkbox button allows you to choose to \"Hold the pledge at $0 for 7 days while I get my feet wet\"")
- Step through the preview and confirmation steps, and your graph will be created.

As you can see, your goal starts with a very low rate, to help show how things work. You could run with this, and lose weight very gradually -- but probably you have a rate or a target in mind, so let's step through how to set that up. - To do that, go to the "Commitment" tab below the graph image.
, \"Stop/pause\", \"Data\", \"Statistics\" and \"Settings\"")
- In the commitment dial, you can set your rate. You may just want to put in your rate per day and leave it at that... but that might be a problem if you have a short-term deadline in mind, and don't want to end up overshooting! So usually with either type of weight goal, you want to open up the extra options by clicking on "Change goal date and goal value".

I want to get to a total of 15 elephants by the end of September, so I'll edit the goal value to 15 and the goal date to 2023-09-30. That automatically calculates a rate of -0.06 elephants per day.

Now I can click commit, and my new rate will kick in a week from now! I've also gone into the goal's settings and adjusted the "display precision" so I don't have to lose a whole elephant at once. Now I know I need to have lost -0.06 elephants in 16 days, or I'll pay $5.


\", with a demonstration below showing the pledge progression: 5, 10, 30, 90... to the pledge cap, which currently shows $270. Below, a checkbox button allows you to choose to \"Hold the pledge at $0 for 7 days while I get my feet wet\"")

, \"Stop/pause\", \"Data\", \"Statistics\" and \"Settings\"")


Keywords: weight loss, weight gain, fitness, goal types, example goals, case studies, hiding the y-axis values, maxflux, fluctuation buffer